Engagement
Engagement assesses the self-reported experiences of seniors with regard to interaction with faculty during their time at Oglethorpe.
Enrollment
Enrollment measures the diversity of the Oglethorpe student body through economic, racial/ethnic, and age diversity.
Outcomes
Graduates are surveyed six months after earning a baccalaureate degree, reporting employment or continuing education.
Student Performance
Student performance accounts for retention rate, graduation rate, and Pell graduation rate.
Experiences with Faculty
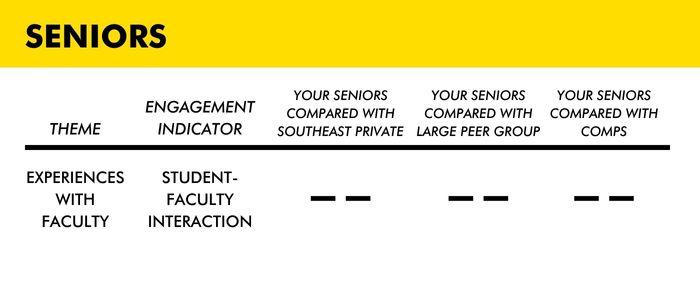
Given the small class sizes and low student-to-faculty ratio, Oglethorpe sees student/faculty interaction as integral to a liberal arts college education. Using NSSE data, Oglethorpe assesses the self-reported experiences of seniors with regard to interaction with faculty. For example, these experiences include: talked about career plans with a faculty member, worked with a faculty member on activities other than coursework, had discussions with a faculty member outside of class, and discussed academic performance with a faculty member.
- Minimum: No significant difference between Oglethorpe seniors’ experiences and those of students attending other private colleges in the southeast (i.e., Oglethorpe students do not report significantly less interaction).
- Target: Statistically significant difference whereby Oglethorpe seniors engage with faculty more than students attending other private colleges in the southeast.
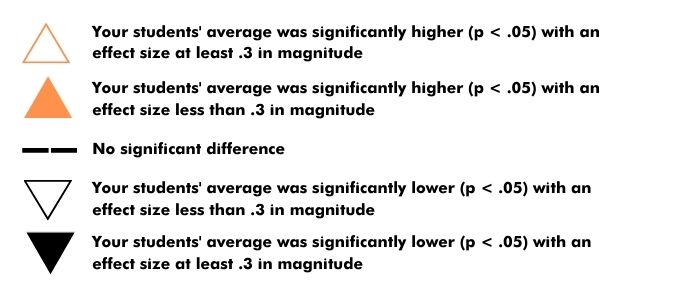
The statistical reporting options are given below.

Oglethorpe Results

- Actual: No significant difference between Oglethorpe seniors’ experiences and those of students attending other private colleges in the southeast.
For 2022, Oglethorpe met the minimum, but did not achieve the target.
Learning with Peers
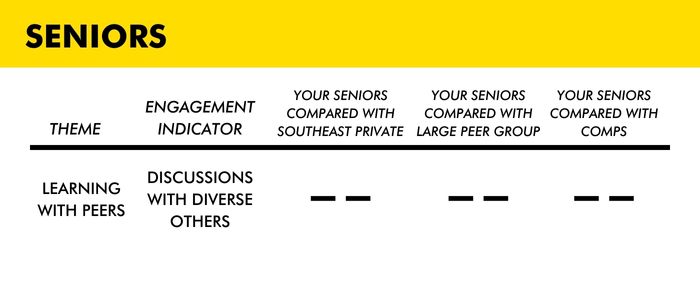
Given the small class sizes and Oglethorpe’s commitment to diversity on campus, Oglethorpe expects that students will engage in discussions with diverse others. Using NSSE data, Oglethorpe assesses the self-reported experiences of seniors with regard to how often they engaged in discussions with diverse others, including: people from a race/ethnicity, economic background, religious belief, and political belief other than their own.
- Minimum: No significant difference between Oglethorpe experiences and those of students attending other private colleges in the southeast (i.e., Oglethorpe students do not report significantly less interaction).
- Target: Statistically significant difference whereby Oglethorpe seniors engage in discussions with diverse others more than students attending other private colleges in the southeast.
The statistical reporting options are given below.

Oglethorpe Results

- Actual: No significant difference between Oglethorpe seniors’ experiences and those of students attending other private colleges in the southeast.
For 2022, Oglethorpe met the minimum, but did not achieve the target.
Economic Diversity
For Academic Year 2020-2021, 35% of first-time, full-time (See definition below) undergraduates attending Oglethorpe University were awarded Pell grants. Oglethorpe seeks to enroll a diverse population of students each year with regard to economic background. The average new student Pell population at Oglethorpe’s peers is 40% and the median is 40%. In order to ensure economic diversity, Oglethorpe would like to have an incoming cohort of students who are awarded Pell that, at a minimum, is at the 25th percentile compared to peers, and a target of within 5% of the peer median. The 25th percentile for the peer group for 2020-2021 was 32% Pell.
- Minimum: 25th percentile (32% Pell)
- Target: within 5% of the peer median (40% Pell)
- Actual: 38% Pell
Oglethorpe met the minimum and achieved the target.
First-time, full-time: A student who has no prior postsecondary experience (except as noted below) attending any institution for the first time at the undergraduate level and is enrolled for 12 or more semester credits.
Racial/Ethnic Diversity
Oglethorpe is located in Atlanta, Georgia and strives to represent the racial and ethnic diversity of its locale. In Fall 2021, 66% of the incoming first-time, full-time cohort identified as Students of Color (this excludes non-resident alien and race/ethnicity unknown from the denominator). This represents a greater racial/ethnic diversity as compared to its peers. Oglethorpe’s peers’ percent of Students of Color in the cohort ranged from 13% to 53% with the average being 32% and median being 29% Students of Color.
- Minimum: 29% students of color
- Target: 50% students of color
- Actual: 66% students of color
Oglethorpe has met the minimum and achieved the target.
Age Diversity
Oglethorpe University is a traditional residential university. However, Oglethorpe does offer evening courses as part of an Adult Degree Program (ADP). This is limited to only a few majors and this program has decreased in enrollment over the past several years. As a result of this offering, and as a commitment to diversity in student enrollment, Oglethorpe strives to enroll students that are considered non-traditional in age. In Fall 2021, 5% of Oglethorpe’s undergraduate population was age 25 or older. The percent of adult students at Oglethorpe’s peers ranged from 1% to 20% with the average being 5% adult students and median being 3%. Oglethorpe sets the peer median as its minimum and works to be at 10% as we strive to increase our transfer and adult programs.
- Minimum: 3% students age 25 or older
- Target: 10% students age 25 or older
- Actual: 5% students age 25 or older
Oglethorpe has met the minimum but not achieved the target. To address this issues, Oglethorpe will work to attract more non-traditional students through greater marketing of and recruitment to the Adult Degree Program.
Employment or Continuing Education
Given Oglethorpe’s commitment to prepare students for success, it participates in the First Destinations Survey conducted by the National Association of Colleges and Employers to gather data on graduates’ experiences after completing their degree. Graduates are surveyed six months after earning a baccalaureate degree. Data show that graduates from Oglethorpe’s Class of 2023 report:
- 65% are employed either full-or part-time
- 22% are continuing their education in full-time graduate studies
- 9% are still looking for employment
- 2% are not currently seeking employment
Using peers, defined as other schools with a Carnegie Classification as Baccalaureate: Arts and Sciences Focus, Oglethorpe has defined:
- Minimum: Peer average (86% employed or in continuing education)
- Target: Exceed peer average by 5%
- Actual: 88% employed or in continuing education
Graduation Rate
The six-year graduation rate (see definition below) represents students who enrolled as first-time, full-time students six years earlier and completed their undergraduate degrees within 150% of the traditional 4-year time frame. Over the last five years, Oglethorpe’s graduation rate has ranged from 47% to 58%. Oglethorpe Peers have ranged from 29% graduation rate to 76% over that same time period. Oglethorpe sets its minimum threshold based on the 25th percentile and the target as being in the 50th percentile of its peers each year. For 2021, Oglethorpe surpassed the minimum standard set and achieved the target.
- Minimum: 25th Percentile (46% Graduation Rate)
- Target: 50th Percentile (58% Graduation Rate)
- Actual: 58% Graduation Rate
For 2021, Oglethorpe surpassed the minimum standard set and achieved the target.
Data are collected on the number of students entering the institution as full-time, first-time, degree/certificate-seeking undergraduate students in a particular year (cohort), and whether they completed within 150 percent of normal time to completion. Typically, this corresponds to a 6-year rate, but some programs may differ.
Retention Rate
The retention rate is an indicator of how well first-year students acclimate to an institution’s academic and social life. Oglethorpe determined that increasing the retention rate was a priority and would be a key component of its SACSCOC Quality Enhancement Plan. Oglethorpe has focused on increasing its retention rate. Because of this effort, Oglethorpe set as its minimum the median retention rate of its peers (72% in 2021) and a target of being in the 80th percentile (78% in 2021).
- Minimum: Peer Median (72%)
- Target: 80th Percentile of Peers (78%)
- Actual: 79% Retention Rate
For 2021, Oglethorpe surpassed the minimum standard set and achieved the target.
Pell Graduation Rate
Given that enrolling an economically diverse student body is a university priority, it is also important that those students are not just provided access, but also see success. Oglethorpe monitors the graduation rate of its Pell students as compared to the non-Pell student body. Given that Oglethorpe’s graduation rate of Pell students reflects about the same difference as its overall graduation rate, Oglethorpe has decided to focus setting minimums and targets based on its own metrics rather than as compared to peers. Currently the graduation rate of Pell students at Oglethorpe is 48%, whereas the graduation rate of all students at Oglethorpe is 58%, reflecting a 10% gap. At its peer institutions, the Pell graduation rate is also 48% and the graduation rate for all students is 58%, reflecting a 10% gap. Thus, Oglethorpe sets as its target the closing of the gap between those two rates. At a minimum, Oglethorpe seeks to have no greater gap than its peers between Pell and overall graduation rate. The target is to close the gap to 5%.
- Minimum: 10% between Pell and overall graduation rate.
- Target: 5% gap between Pell and overall graduation rate.
- Actual: 10% gap between Pell and overall graduation rate.
Oglethorpe has met the minimum but not achieved the target. To address this issue, Oglethorpe will expand Pell students to ensure that they are aware of and promote greater use of Oglethorpe student success programs and activities.